Artificial Intelligence for Trading
PETRELLI-CESARINI model, an example of AI model for price forecasting in financial markets
Published by Donata Petrelli on 28/04/2021
Image credits by ztYmIQecyH4 on Unsplash
Reading Time: 8 minutes
The joy of looking and comprehending is nature’s most beautiful gift
… Albert Einstein used to say.
If to observe reality we need will, curiosity, passion and analytical spirit, i.e. subjective qualities, to be able to understand it, scientific methods come to our aid. Each sector has its own specific characteristics and techniques.
Traditionally, in the field of financial markets, in addition to methods borrowed from Mathematics and Statistics, Technical Analysis and Fundamental Analysis are used to study data aimed at supporting an investment. However, thanks to its diffusion and wide use in many disciplines, for the analysis of financial market data are taking more and more space also techniques of Artificial Intelligence, in particular Data Mining.
Considering that it is not possible to predict the future in any way, one of the purposes of these methodologies is to study the price trend of financial markets over time in order to predict future trends and arrive at an estimate of that value which comes closest with the highest probability to the future value assumed by a certain asset.
There are models already ‘ready to use’ for the predictive analysis of data and time series but we can also create new ones or customize existing ones. One of these models is the PETRELLI-CESARINI model designed and developed by Fabrizio Cesarini and myself and presented in the book “Excel and Artificial Intelligence For Trading“. This is a method of analysis of financial markets, based on a particular technique of Artificial Intelligence, the Cluster Analysis but which makes a combined use of mathematical and statistical methodologies. The underlying logic is that of the forecasting model that bears the name of its creators, PETRELLI-CESARINI, whose purpose is to find the next most likely value of a financial asset.
For the one who was curious to see like it is realized a model, in this article I use the example of the PETRELLI-CESARINI model with the scope to stimulate the analytical spirit and the creativeness of the reader 🙂
Importance of the model
Let’s start from the beginning. From the theory of mathematical models we know that a model serves to represent mathematically a real phenomenon in order to create an ‘artificial environment’ to support the solution of the problem of the represented situation. So, the purpose of the model is to help find a mathematical solution to a concrete problem. In order to understand what makes the model we start therefore from its objective.
The PETRELLI-CESARINI model was born from the need to find a decisive method regarding the question of the positioning of a future value of an asset price and that does not take into account the more traditional theories, according to which prices tend to repeat themselves with time. We therefore formulated a theory of “price attraction” to central prices, also called targets. This theory is translated into a mathematical formula, the PETRELLI-CESARINI formula, which can be derived from the assumptions of the model
The formula is the expression of an index of measure able to express the probability with which a price tends to approach one of reference (target price) and is the synthesis of a precise process realized exactly through a mathematical model, with the homonym name to the formula of the index.
In synthesis, the model is born like ‘container’ of the formula from which it takes the name.
Goals
Thanks to a model we can:
- give shape to our thoughts
- support reasoning
- communicate clearly
- to simplify complex systems
The purpose of a model is to provide a final solution, in our case a numerical price prediction value, in the form of a product or service that is usable by a user.
The successive step to the realization of the model, based on the PETRELLI-CESARINI formula, is therefore that one of the realization of its descriptive Algorithm in order then to proceed to the final realization of tools for its practical use.

Once the Algorithm is realized, the possibilities to realize a tool become multiple. We will see later how to make a final software tool.
Data
PETRELLI-CESARINI model is a predictive model of the prices of financial instruments, in particular Stocks and Etf. In general, however, can be applied to all other assets in financial markets, taking into account that the complexity in dealing with these data is intrinsic to the nature of the financial instrument. In the specific case for the writing of the article, a share is taken into consideration.
In fact, data is the expression of the environment of which it is part. A thorough knowledge of the environment from which they originate is a necessary condition for all phases of analysis. Just to cite an example, if we deal with Futures or Options, we must take into consideration that they are derivatives and that their value therefore derives from another financial instrument.
Another aspect to consider when working with financial data are:
- time frame
- time period
Traditionally we tend to consider data measured at evenly spaced intervals usually daily but also weekly or monthly. Over the course of the day, you get four price information related to the session:
- Open
- High
- Low
- Close
Considering time frames of less than one day, we talk about Intraday data, i.e. what happens within a day. In this case the time frame is 12 hours, 6 hours, 1 hour but also minutes, seconds, fractions of a second. A more modern trend in finance consists in the study of so-called high frequency data, i.e. observations recorded in real time on the markets and therefore of every single transaction.
Depending on the purpose of the analysis, one type of reading is preferred over the other. Keeping in mind two aspects however unavoidable:
- difficulty of data collection
- complexity of its treatment
In the explanation of the PETRELLI-CESARINI model in this article will be used for educational reasons only the daily closing prices. In its original form, the model is created so as to be independent of: type of financial asset, type of historical data, time period and time frame.
Model Description
Given a history of values of a financial asset and the reading of the last available data, the model is concerned with finding the most probable future value of the next data of the asset.
First of all, there is the phase of acquisition of the data of the asset (the history and the last price) and of the parameters necessary for the execution of the Algorithm and their validation (the ticker, the number k with which we want to divide the practice data, the lastPrice). Then we pass to the next phase of ETL on the data that provides a pre-processing in order to make it easier to calculate the algorithm.
Once taken and prepared the initial data we pass to the real analysis.
The PETRELLI-CESARINI price forecasting model takes its cue from the K-Means algorithm, one of the most important and innovative algorithms of Artificial Intelligence for the division of initial raw data into groups, for the implementation of a new Clustering system. While the technique of K-Means starts from the data to be analyzed and finds the division into groups (clusters) independently once assigned the number of clusters that you want to obtain, the technique of clustering used by this model instead provides in a predefined way a division into groups, always after defining the number K of the groups that you want to obtain. In particular, the model operates beginning from a temporal subdivision of the data of the daily closing prices, like brought back in Figure 2.
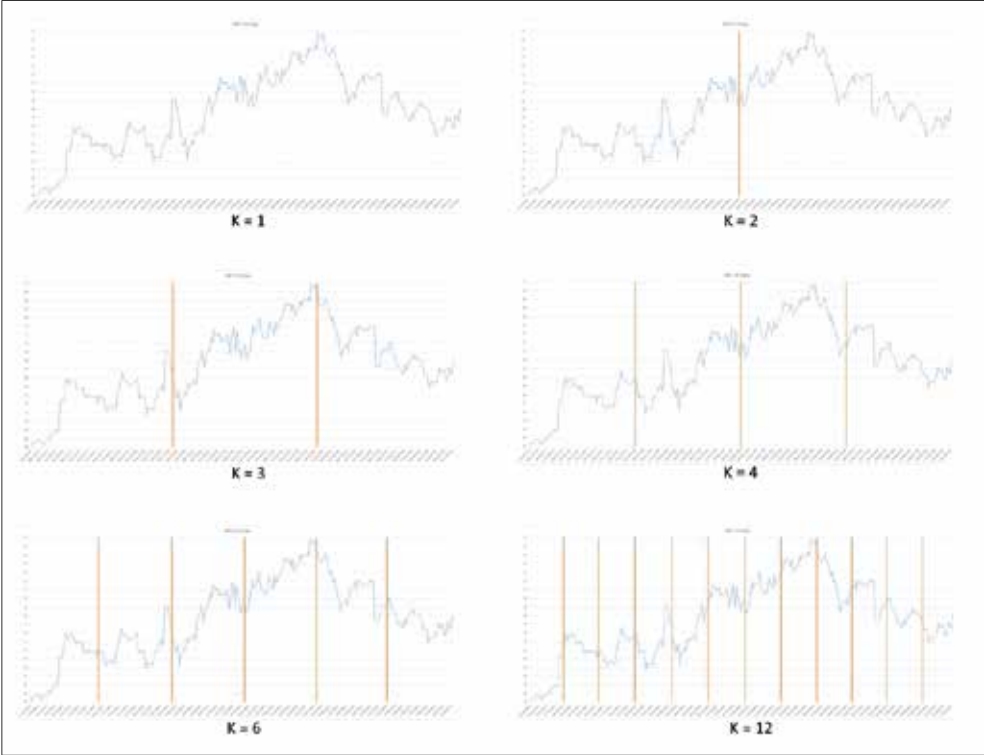
The choice of K is not made randomly, but with a logic that depends on the time period and time frame initially chosen. For example if the time period is three months we will choose three groups (K=3) so that we will have a grouping for each month, therefore, being a month of four weeks, a week of five sessions, we will have twenty sessions for each group. According to one’s own trading strategy and according to the type of temporal analysis one wants to perform, the user selects the most appropriate K value.
After this division in subgroups, the phases that follow the model are phases of mathematical and statistical calculations. In fact, after the clustering produced by the model, for each group found we calculate the Average that corresponds, wanting to make an analogy with the method of K-Means to the calculation of the centroid of the single cluster. Then for each group of data we calculate the Standard Deviation using the Average value previously found. So we perform the probabilistic calculations to get to the final result.
Result
Once calculated the Normal Distribution of the prices of every group of data, the PETRELLI-CESARINI formula is carried out for the elaboration of the ‘relative probability’ of a group. Every group obtained from the particular type of clustering put in action from the model has, according to the interpretation of the model, a relative probability that is given from the relationship between the normal distribution of the group and the sum of the normal distributions of the K groups.
This formula is the PETRELLI-CESARINI Index that holds account of the partition K of the groups of departure.
At the end of the calculation of the relative probability a list of relative probabilities is obtained. If I have three groups the vector of the relative probabilities is constituted from three elements, three values of relative probability. Of these the model selects the highest value. This value will be corresponding to an index of the vector that, in turn, corresponds to a group of the clusterization. For example, if the highest probability is that of the second element of the vector of relative probabilities, it means that the most probable group in which we will obtain the next price will be in the second group (cluster), therefore its value tends to approach the center of this group.
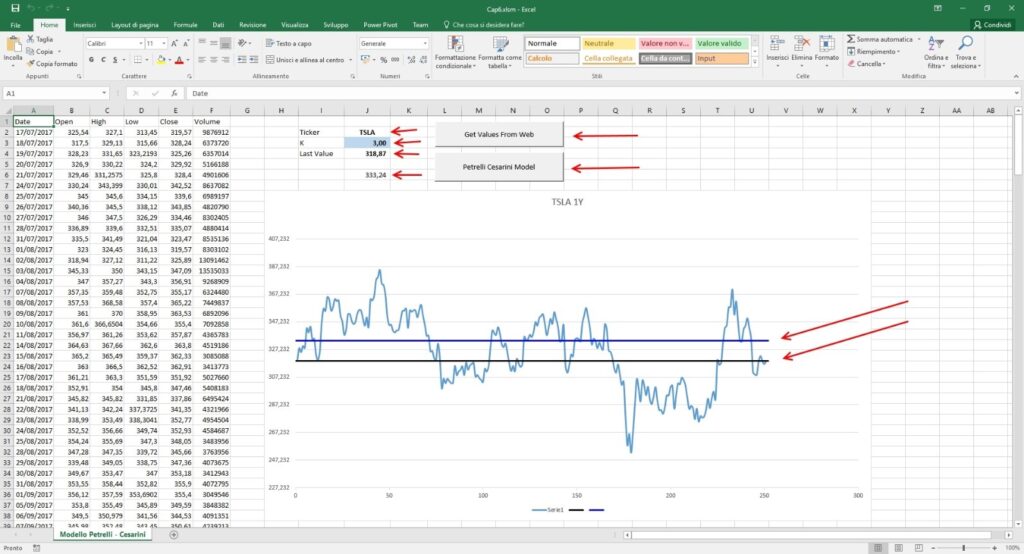
The final result produced is given by the probability of the next price to approach the average value of the second group.
Tools
Once we have the model, we need to figure out what tools to adopt to make the best use of Artificial Intelligence. Below is a concise but comprehensive overview of the various possibilities:
- Excel and VBA
- R and its tools
- Python
- C/C++
- .NET
- Azure
Once again, the choice of the best tool or language depends very much on the level of complexity of the work to be done and the goals to be achieved.
Conclusion
This article is only an introduction to a method of forecasting financial market prices that makes use of Artificial Intelligence techniques. By its very nature it is not possible here to go into all aspects, including the underlying formulas and the source code that translates them into programming language.
To deepen these aspects and for more information and explanations about its functioning, I suggest reading “Excel and Artificial Intelligence for Trading” where there is a whole chapter dedicated to the model.
My objective is that one to stimulate the curiosity and the creative spirit. All models are always personalizable and optimizable in one optical of improvement of the performances or of adaptation to new objectives or change of the parameters. Every intuition, once analyzed, can be implemented and verified. Only the final analysis in fact concurs to verify the goodness of a new model and the comparison with other previous or analogous ones. From here, from the analysis of the deviations, we can then understand the rate of improvement.
I hope you found it inspiring for your own modeling. I also invite you to sign up for my free newsletter to stay updated and continue to follow my posts.
Published with licenza CC BY-NC-ND 3.0 IT (Creative Common – Attribuzione – Non commerciale – Non opere derivate 3.0 Italia)
